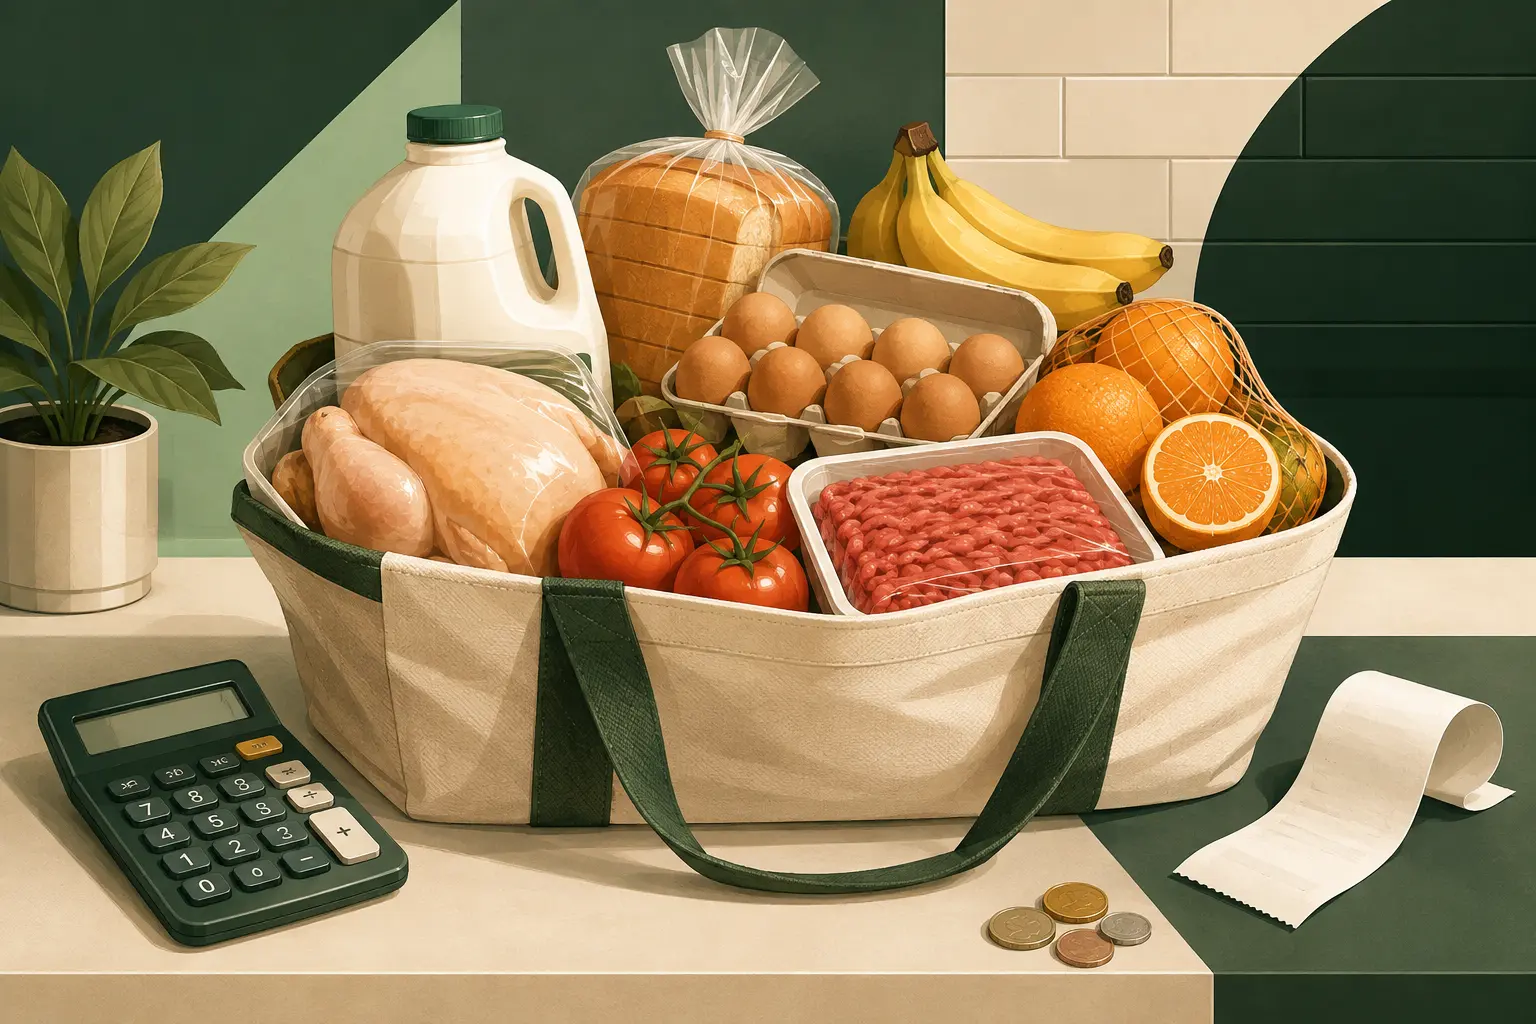
Quarterly grocery price check
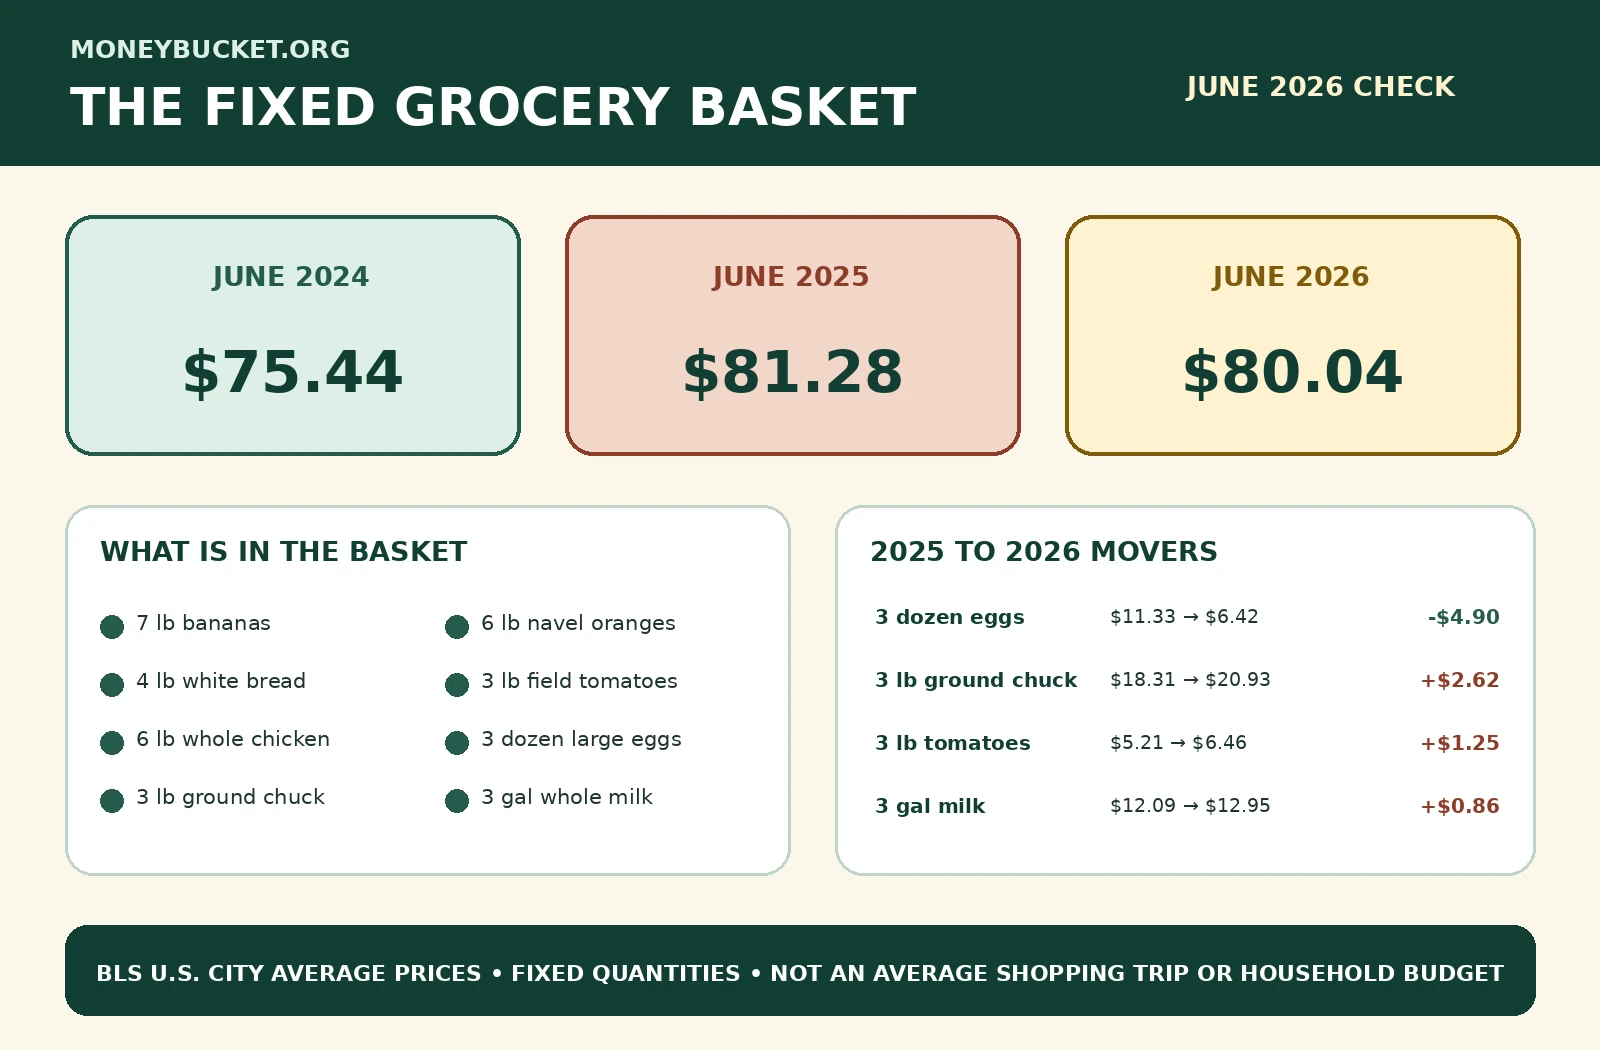
A fixed basket of eight foods costs $80.04 using June 2026 BLS U.S. city average prices. The same quantities cost $81.28 in June 2025 and $75.44 in June 2024. The one-year total fell 1.5% because eggs became much cheaper, but the basket still costs 6.1% more than it did two years earlier. The Save Money guide connects this price check with practical ways to reduce household spending.
This is a price-tracking example, not the average grocery trip, a recommended diet, or a household food budget.
The $80 basket check in 53 seconds
Read the video transcript
- 00:00: A fixed BLS-priced basket costs $80.04 in June 2026.
- 00:06: Eight foods, the same quantities, and the same national BLS price series.
- 00:13: June 2024 total: $75.44.
- 00:19: June 2025 total: $81.28, up $5.84 in one year.
- 00:26: June 2026 total: $80.04, down $1.24 from 2025 and up $4.60 from 2024.
- 00:32: Three dozen eggs fell from $11.33 to $6.42. Beef, tomatoes, and milk rose.
- 00:39: Grocery CPI still rose 2.7% because it covers a broader, weighted mix.
- 00:45: Repeat the check each quarter with unchanged items and quantities.
Three years, one unchanged basket
The important result: A falling total does not mean every item became cheaper. Eggs removed about $4.90 from this basket between June 2025 and June 2026, while ground chuck added about $2.62, tomatoes added $1.25, and milk added $0.86.
What is inside the fixed grocery basket?
The basket uses the foods and units shown in the BLS selected average-price table. Quantities stay unchanged across all three years. Totals use the published unit prices before the final result is rounded to the nearest cent.
| Food | Fixed quantity | June 2024 unit price | June 2025 unit price | June 2026 unit price |
|---|---|---|---|---|
| Bananas | 7 lb | $0.625/lb | $0.654/lb | $0.645/lb |
| Navel oranges | 6 lb | $1.582/lb | $1.633/lb | $1.540/lb |
| White bread | 4 lb | $1.973/lb | $1.864/lb | $1.814/lb |
| Field-grown tomatoes | 3 lb | $1.843/lb | $1.737/lb | $2.154/lb |
| Fresh whole chicken | 6 lb | $2.007/lb | $2.086/lb | $2.044/lb |
| Grade A large eggs | 3 dozen | $2.715/dozen | $3.775/dozen | $2.141/dozen |
| Ground chuck | 3 lb | $5.364/lb | $6.103/lb | $6.975/lb |
| Fresh whole milk | 3 gal | $3.956/gal | $4.029/gal | $4.317/gal |
Download the basket data as a CSV.
What the basket leaves out: Rice, pasta, cereal, cheese, coffee, frozen foods, canned foods, snacks, cooking oils, condiments, and many other common purchases are not included because the selected BLS table does not publish national average dollar prices for every grocery item.
Why did this basket get cheaper in 2026?
Eggs did most of the work. The BLS average price for a dozen Grade A large eggs fell from $3.775 in June 2025 to $2.141 in June 2026. With three dozen in the basket, that change cut about $4.90 from the total.
Eggs: down $4.90
The three-dozen line fell from $11.33 to $6.42.
Ground chuck: up $2.62
The three-pound line climbed from $18.31 to $20.93.
Tomatoes: up $1.25
The three-pound line climbed from $5.21 to $6.46.
Milk added about $0.86. Smaller declines in oranges, bread, chicken, and bananas helped keep the 2026 total below the 2025 result.
How can this basket fall while grocery CPI rises?
The BLS reported that food-at-home prices rose 2.7% over the 12 months ending June 2026. That broad index covers a large, weighted mix of grocery categories. This eight-food basket gives three dozen eggs a much larger role than eggs have in a typical national spending pattern.
The two measures answer different questions:
| Measure | Question it answers | What it covers |
|---|---|---|
| Food-at-home CPI | How did grocery prices change across the broader U.S. market? | A weighted mix of grocery categories and price samples |
| MoneyBucket fixed basket | What do the same eight selected foods and quantities cost? | Eight items available in the BLS average-price table |
| Your receipts | What did your household pay at the stores you used? | Your brands, package sizes, stores, substitutions, sales, and location |
Where USDA Food Plans fit
USDA publishes Thrifty, Low-Cost, Moderate-Cost, and Liberal Food Plans. These are model food budgets built around nutritious meals prepared at home. They vary by age, sex, household size, and plan level.
An $80 basket cannot stand in for a USDA monthly plan. It has too few foods, does not represent a complete diet, and does not account for the household adjustments used in USDA reports. Use USDA Food Plans as planning benchmarks and use your receipts to see what your own household is paying.
How to track grocery inflation with your own cart
Choose a basket you buy often
Pick 10 to 20 foods that appear on many of your receipts. Include the package size, weight, or volume for each one.
Record unit prices
A shelf price can look lower because the package shrank. Compare price per pound, ounce, gallon, dozen, or other consistent unit.
Keep the rules unchanged
Use the same quantities and the same brand rule each time. If store brand is the rule, keep it store brand. If the exact product disappears, record the substitution.
Choose a steady date
Check monthly or quarterly. A fixed schedule prevents one unusually good sale or one rushed trip from becoming the full story.
Compare the total and the movers
The total shows budget pressure. Item-level changes show where a swap, seasonal choice, or meal-plan change might help most.
For practical shopping steps, use the MoneyBucket grocery savings guide. If food spending keeps knocking the rest of the month off course, add a grocery line to the MoneyBucket budgeting guide and review it after each shopping week.
What to do when grocery categories move in opposite directions
Plan proteins as a group
Compare beef, chicken, eggs, beans, fish, and other proteins by cost per meal, not only cost per package.
Let produce rotate
Keep a fruit and vegetable target, then choose among in-season or better-priced options that fit the meals you will make.
Measure waste too
The cheapest item is not a saving if it spoils. Track what gets eaten, frozen, repurposed, or discarded.
Frequently asked questions
Is $80 the average U.S. grocery trip?
No. The $80.04 result comes from a fixed example using eight selected BLS price series and set quantities. Household size, location, store, diet, brands, and trip length can change a real receipt sharply.
Why did the fixed basket fall when grocery prices rose overall?
Eggs carry unusual weight in this small basket and became much cheaper over the year. Food-at-home CPI covers a broader, weighted mix, so the two results do not need to move together.
Which item moved the basket most?
Eggs. Three dozen fell from about $11.33 in June 2025 to $6.42 in June 2026, cutting roughly $4.90 from the total.
Should I compare total receipt amounts?
Only if the purchases are comparable. Unit prices and fixed quantities give a cleaner comparison because trip size, stock-up purchases, sales, and package changes can distort receipt totals.
How often will this basket be checked?
The method is built for quarterly checks. The foods and quantities stay fixed while the BLS price month is replaced with the newest quarter-end data.
Sources and method
- U.S. Bureau of Labor Statistics, selected average-price data: June 2024, June 2025, and June 2026 unit prices.
- U.S. Bureau of Labor Statistics, June 2026 Consumer Price Index summary: food-at-home monthly and 12-month changes.
- USDA Economic Research Service, July 2026 Food Price Outlook: category changes and the 2026 food-at-home forecast.
- USDA Food Plans: the four at-home food-budget plan levels and their use as nutrition-planning benchmarks.
Calculation: Each line equals the fixed quantity multiplied by the BLS unit price for that month. Line values remain unrounded until they are added. The basket total is then rounded to the nearest cent. June 2024 totals $75.435, June 2025 totals $81.280, and June 2026 totals $80.036.
Limits: BLS average prices are U.S. city averages, not store quotes. The basket excludes many common grocery categories and gives each chosen item a fixed quantity that may not resemble a household’s purchases.