MoneyBucket Data Study
Who Gets to Save for Retirement Through Work?
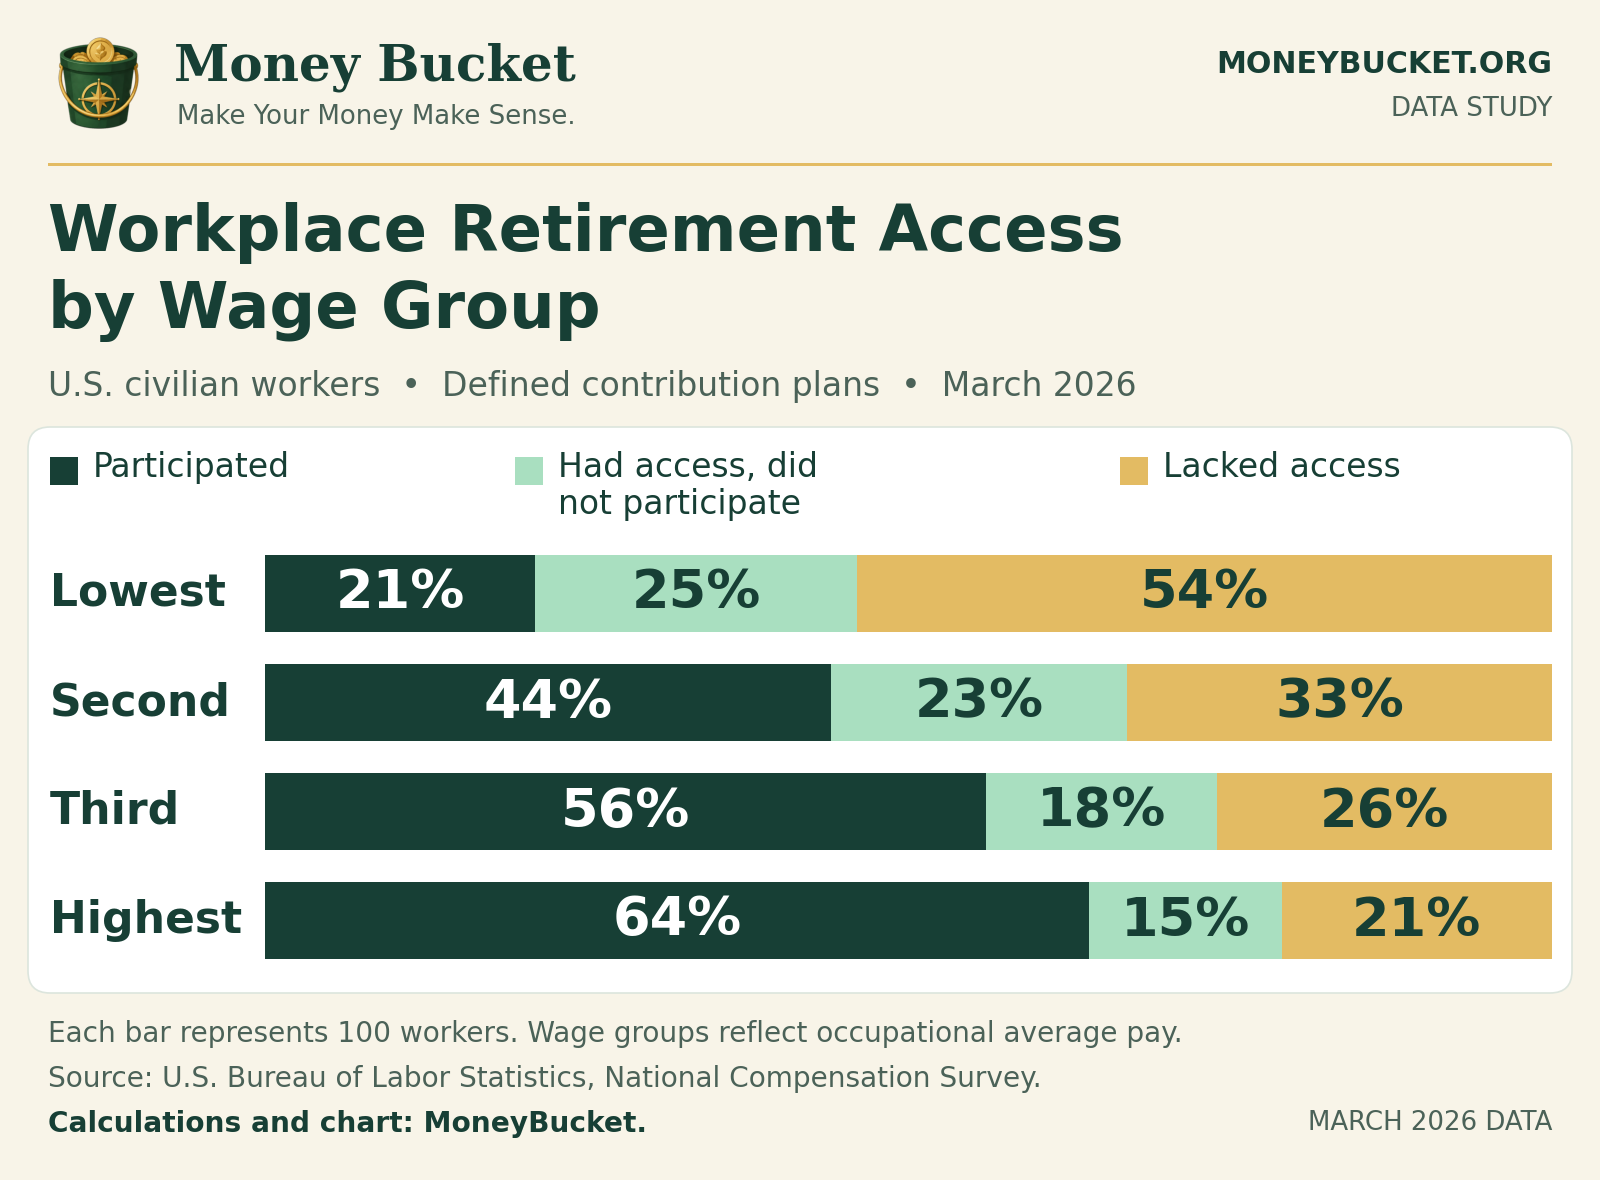
About one in three U.S. civilian workers in the second wage quartile lacked access to a workplace defined contribution plan in March 2026. This study builds on MoneyBucket’s saving and investing guide by separating workers who had a plan available from those who participated.
For someone comparing job offers, that makes one question worth asking before doing the math on a 401(k) match: “Does this job offer a plan I can join, and when could I start?”
A defined contribution plan, such as a 401(k), gives each participant an account within the employer’s plan. Contributions may come from the worker, the employer or both. If you are deciding how much of your next paycheck to set aside, start with the terms available at your job and the bills that paycheck has to cover.
What Do the Two Middle Wage Groups Show?
The two groups around the middle of the pay scale are a useful place to look. In March 2026, the second group covered occupations averaging at least $19.44 but less than $26.74 an hour. The third covered occupations averaging at least $26.74 but less than $42.03.
A worker can earn more or less than the average for their occupation. The bands describe jobs and tell us little about a household’s other income or expenses. BLS wage definitions.
| Occupational Wage Group | Participated | Had Access, Did Not Participate | Lacked Access |
|---|---|---|---|
| Lowest | 21% | 25% | 54% |
| Second | 44% | 23% | 33% |
| Third | 56% | 18% | 26% |
| Highest | 64% | 15% | 21% |
The three shares in each row sum to 100%. The second and third numeric columns are calculated from published whole percentages. Source: BLS wage-group table.
In the third group, 56 of every 100 workers participated, 12 more than in the second group. That difference has two parts. Seven fewer workers per 100 lacked access, and five fewer had access without participating. A higher participation rate can reflect changes on either side of the enrollment decision.
Suppose you already know your employer offers a plan. How common is it for workers with that option to participate? BLS calls this the take-up rate. In the second group, 44 participants out of about 67 workers with access gives roughly 66%. In the third group, the published rate is 76%. Using all workers as the denominator instead gives 44% and 56%. Both comparisons are accurate. They answer different questions. BLS take-up estimates.
How Does Counting Pensions Change the Answer?
A worker can lack access to a 401(k)-style account and still earn a traditional pension. When BLS counts access to either kind of plan, 74% of the second wage group has a workplace retirement benefit. That leaves 26% without either kind, compared with 33% without a defined contribution plan.
In the third group, the share without either kind drops to 14%, compared with 26% without a defined contribution plan. BLS retirement benefits, Table 1.
| Wage Group | Access to a DC Plan | Take-Up Among Those With DC Access | Access to Either Plan Type | No Access to Either Type |
|---|---|---|---|---|
| Lowest | 46% | 45% | 50% | 50% |
| Second | 67% | 66% | 74% | 26% |
| Third | 74% | 76% | 86% | 14% |
| Highest | 79% | 81% | 94% | 6% |
DC means defined contribution. Take-up uses workers with access as its denominator; the other shares use all workers in the wage group. Either plan type means a defined contribution plan or a defined benefit pension, with workers who have both counted once. No access to either type equals 100 minus any-plan access. Sources: BLS wage-group data and Table 1 of the March 2026 release.
This distinction matters if one job offer lists a pension and the other advertises a match. Request the pension’s benefit estimate and the account plan’s contribution terms. A blank line next to “401(k) match” can tell you very little about the value of the first offer.
What Should I Ask Before My First Paycheck?
Ask the benefits contact to walk you through your own start date and work schedule. “We have a retirement plan” tells you the employer offers something. You still need to know which plan covers the position, when you become eligible, and when the first contribution can appear. For a plan with employee contributions, ask whether enrollment is automatic or whether you need to submit an election. IRS guide to plan documents.
Then put the match in paycheck dollars. Imagine an offer pays $2,000 gross every two weeks. The employer matches 50 cents for every dollar you contribute, up to 4% of eligible pay. If the whole $2,000 is eligible, a 4% contribution puts $80 from that check into the account and earns a $40 employer contribution. At 2%, you put in $40, and the employer adds $20.
Those are illustrative terms. The written formula for your job determines the actual amount. IRS explanation of matching contributions.
If your schedule changes from week to week, try the calculation on a smaller paycheck as well as a typical one. Look at what would still be available for rent, groceries and transportation. Then ask when the employer’s contribution becomes yours to keep. That date can matter if you expect to switch jobs before reaching the plan’s vesting milestone. IRS guide to vesting.
If there is no workplace account, ask whether the position earns a pension. If neither benefit is available, leave the employer contribution at zero in your comparison. List any savings you already hold separately, including money in a former employer’s plan. That gives you a starting balance for planning and makes it easier to see what the new job would add. See MoneyBucket’s retirement planning guide.
What Can These Numbers Tell About a Worker?
The survey measures who had access and who participated at one point in time. It cannot tell us why a particular person did not participate, what their employer contributed, or whether their household could afford another payroll deduction.
Someone in the participation column might have a small balance. Someone outside it might have saved for years at a previous job. The figures describe the opportunity attached to work in March 2026. Your benefits documents and account statement supply the details for your own decision.
How We Calculated the Results
MoneyBucket used all four occupational wage quartiles in the March 2026 National Compensation Survey chart for U.S. civilian workers. BLS combines covered private industry jobs with state and local government jobs. The survey excludes, among others, federal employees, agricultural workers, private household workers and the self-employed.
BLS reports about 8,090 responding establishments across the survey. The public wage chart gives estimates for each group without a separate worker sample count for each bar. BLS survey scope and sample.
For each group, we kept the weighted percentages BLS published. We subtracted participation from access to find the share who had access without participating. We subtracted access from 100 to find the share who lacked access. For example, in the lowest group 46% had access and 21% participated. The remaining workers fall into two groups: 25% had access without participating and 54% lacked access.
The “out of 100” figures translate percentages into a common unit. They are approximate because BLS rounds its published estimates. BLS uses unrounded data for its take-up rates, so dividing the displayed figures can give a slightly different result.
The comparisons describe differences between survey estimates. We did not test them for statistical significance or estimate the effect of a pay raise on any individual worker. We did not pool the quartiles or treat the four published estimates as a sample of four individual workers.
Data Availability
The public BLS chart includes access, participation and take-up for both defined contribution plans and traditional pensions. Its “Show table” option displays the underlying percentages. The March 2026 release preserves the wage cutoffs and its Table 1 counts workers with access to at least one type of retirement plan, including workers with access to both.
BLS wage-group data · March 2026 release and Table 1
Study Data Fields and Definitions
Each row is one U.S. civilian occupational wage quartile in March 2026. The CSV retains BLS whole-percent estimates and MoneyBucket’s two calculated shares. A value of 46 means 46%, not 0.46.
idandquartile- The row identifier, Q1 through Q4, and its occupational wage group. Groups use occupations’ average hourly pay, not household income.
dc_access_pct- Percent of all workers in the wage group with access to a defined contribution plan.
dc_participation_pct- Percent of all workers in the wage group who participated in a defined contribution plan.
dc_take_up_pct- BLS’s published participation rate among workers with defined contribution access. Its denominator is workers with access.
dc_access_without_participation_pct- Calculated as defined contribution access minus participation, using all workers in the wage group as the denominator.
dc_no_access_pct- Calculated as 100 minus defined contribution access, using all workers in the wage group as the denominator.
any_plan_access_pct- Percent with access to a defined contribution plan, a defined benefit pension, or both. A worker with both is counted once.
period,geographyandpopulation- The reporting month, country and covered workforce. All four rows use March 2026, United States and BLS civilian workers.
checkedandchecked_timezone- The source verification date is November 20, 2026, using America/New_York (Eastern Time).
dc_sourceandany_plan_source- The public BLS source URLs for defined contribution measures and any-plan access.
All four records have complete measures. The selection excludes overlapping deciles and separate private-industry or state-and-local-government rows.
Suggested Citation
MoneyBucket. “Who Gets to Save for Retirement Through Work?” Published November 20, 2026. Analysis of the U.S. Bureau of Labor Statistics National Compensation Survey, March 2026.
https://moneybucket.org/saving-investing-money/who-gets-to-save-for-retirement-through-work/