
Cash-Flow Guide and Calculator
Why a $100,000 Salary Can Still Feel Tight
A six-figure salary sounds like a finish line. The checking account may tell a different story. Start with MoneyBucket’s Budgeting Guide for the broader planning framework. This guide separates gross pay, paycheck deductions, fixed costs, flexible costs, debt, care, and savings so you can see which category is taking the biggest bite.
Last source and arithmetic review:
Why can $100,000 feel like less than expected?
A $100,000 salary can feel tight because gross income is not spendable income. Payroll taxes, benefit costs, retirement contributions, housing, transportation, food, care, debt payments, and irregular bills can claim most of each check. The useful question is not whether $100,000 is enough. It is which categories are consuming your take-home pay and what can change.
Watch the $100,000 Cash-Flow Example
See how the same hypothetical monthly model moves from $8,333 in gross pay to a $0 remainder after payroll deductions, core costs, debt, care, savings, and flexible spending.
Read the video transcript
- 00:00-00:06: A $100,000 salary can still feel tight. Gross pay is not the same as spendable income.
- 00:06-00:13: Find monthly take-home pay. $8,333 gross minus $2,100 in payroll deductions leaves $6,233.
- 00:13-00:19: Price housing and transport. Two large fixed categories can claim $3,050 before the month gets moving.
- 00:19-00:26: Add food and household bills. $900 for food plus $550 for recurring bills brings the running total to $4,500.
- 00:26-00:32: Count debt and care. $600 in debt payments and $450 in care or medical costs bring the total to $5,550.
- 00:32-00:39: Keep savings visible. $500 for savings and sinking funds is protected money, not missing money.
- 00:39-00:45: See what is left. $183 in flexible spending assigns the last dollar. The monthly remainder is $0.
- 00:45-00:53: Find the biggest pressure point. Replace the sample with your numbers. Start with the largest adjustable category.
The example is hypothetical. It is not a tax estimate, national average, or recommended budget.
$100,000 Is Above Common U.S. Income Benchmarks
There is no single government statistic called the average U.S. salary. In 2024, the U.S. Census Bureau reported median earnings of $63,360 for full-time, year-round workers and $51,370 for all workers with earnings. Median household income was $83,730. The Social Security Administration’s 2024 National Average Wage Index was $69,846.57. These measures cover different groups, but each one is below $100,000.
| Measure | Figure | What it measures |
|---|---|---|
| Median earnings for full-time, year-round workers | $63,360 in 2024 | The midpoint for workers age 15 and older with earnings who worked at least 35 hours per week and at least 50 weeks during the year. |
| Median earnings for all workers | $51,370 in 2024 | The midpoint for workers age 15 and older with earnings, including part-time and full-time workers. |
| Median household income | $83,730 in 2024 | The midpoint of pretax money income across U.S. households. It is a household figure, not one worker’s salary. |
| National Average Wage Index | $69,846.57 in 2024 | An index used by Social Security to adjust earnings and program amounts. It is not a median salary. |
| Mean income before taxes per consumer unit | $104,207 in 2024 | A BLS consumer-unit mean that includes wages and salaries plus self-employment, Social Security, retirement, investments, and other income. It is not average worker pay. |
| Average annual expenditures per consumer unit | $78,535 in 2024 | Mean spending across BLS consumer units, not a recommended budget or a median. |
| Average housing plus transportation spending per consumer unit | $39,584 in 2024 | $26,266 for housing plus $13,318 for transportation, equal to 50.4% of average expenditures. |
| Average worker contribution for employer family health coverage | $6,850 in 2025 | The average annual premium contribution among covered workers with family coverage. |
| Adults with at least one major unexpected expense | 59% in 2025 | The share reporting at least one major unexpected expense during the prior 12 months. |
The $104,207 BLS figure must not be described as average salary. BLS defines a consumer unit as a family, a financially independent person, or people living together who share major expenses. Its income measure can combine several people and several types of income. The BLS data is used here only to show consumer-unit spending patterns.
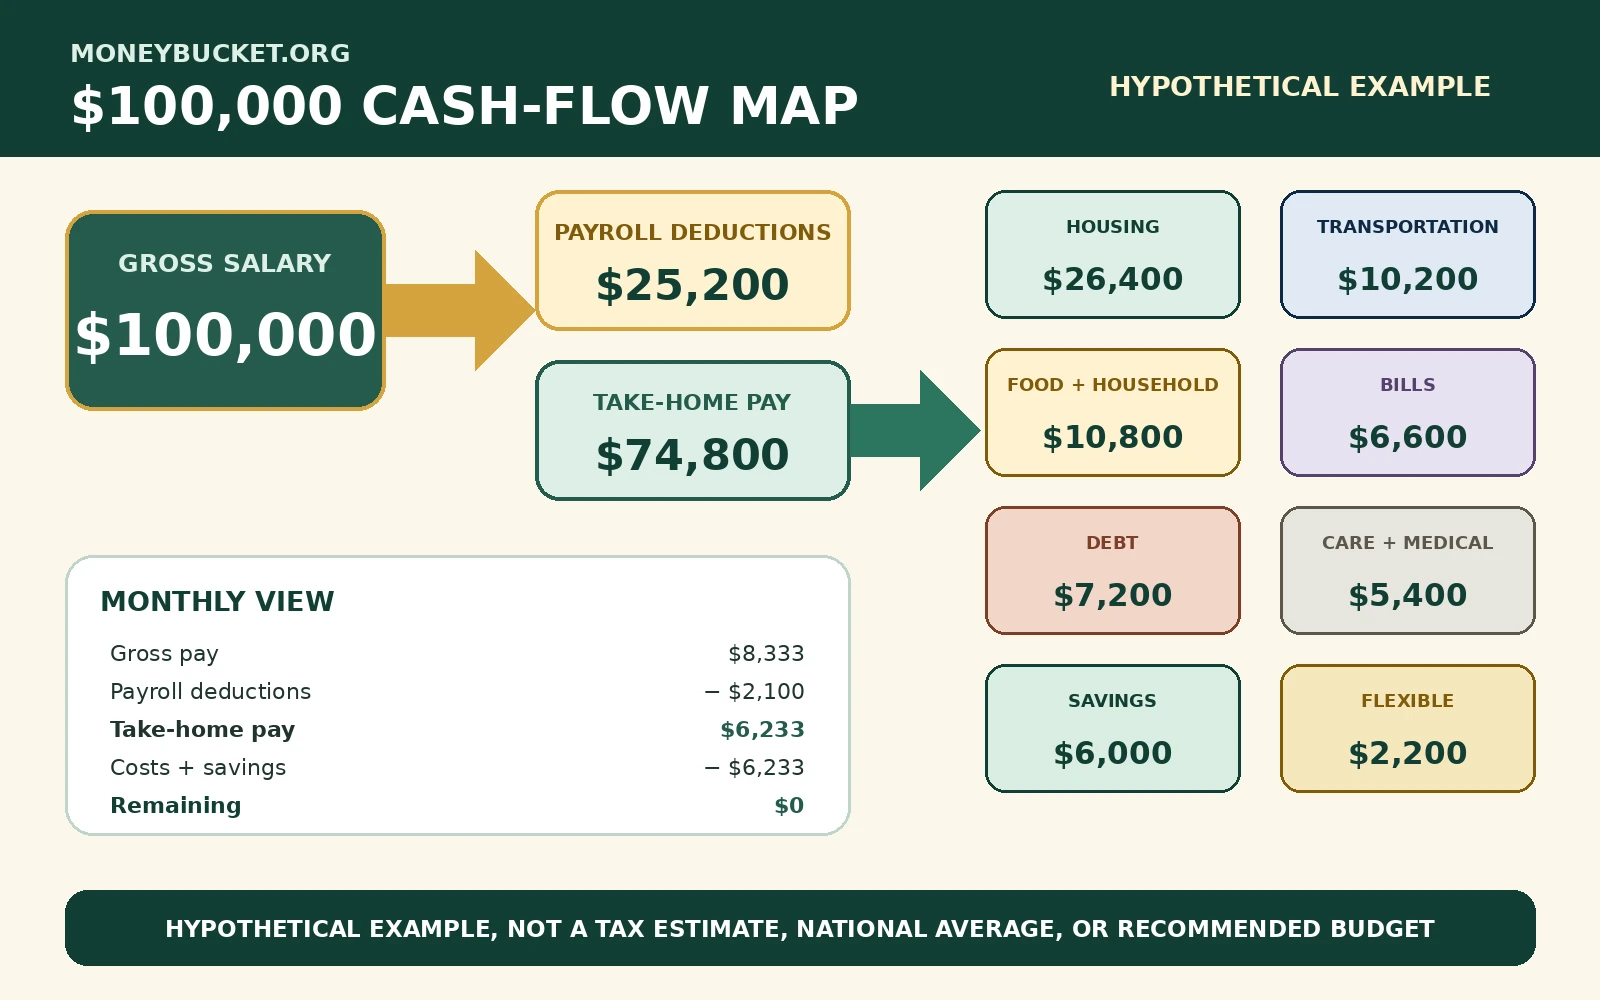
A Plain-Language $100,000 Cash-Flow Example
The model below is hypothetical. It is not a tax estimate, national average, or recommended budget. It simply assigns every dollar so you can see why gross salary and financial breathing room are different numbers.
| Category | Annual amount | Monthly amount | What it includes |
|---|---|---|---|
| Gross salary | $100,000 | $8,333 | Pay before payroll deductions |
| Payroll deductions | $25,200 | $2,100 | Illustrative tax withholding, payroll taxes, health premiums, and retirement contributions |
| Take-home pay | $74,800 | $6,233 | Money available after paycheck deductions |
| Housing | $26,400 | $2,200 | Rent or mortgage and housing fees |
| Transportation | $10,200 | $850 | Payments, fuel, insurance, repairs, parking, or transit |
| Food and household | $10,800 | $900 | Groceries, household supplies, and dining |
| Utilities, insurance, and phone | $6,600 | $550 | Recurring household bills outside housing |
| Debt payments | $7,200 | $600 | Credit cards, student loans, personal loans, or other debt |
| Care and medical costs | $5,400 | $450 | Out-of-pocket health costs, childcare, or family care |
| Savings and sinking funds | $6,000 | $500 | Emergency savings and planned irregular expenses |
| Flexible spending | $2,200 | $183 | Clothing, gifts, entertainment, and unplanned small costs |
| Remaining | $0 | $0 | Every dollar has already been assigned |
Build Your Own Salary Cash-Flow Map
Use monthly figures from your pay stub, bank activity, bills, and debt statements. The sample amounts match the worked example above. Change every field to match your household.
Method: monthly take-home equals gross pay minus payroll deductions. Monthly amount left equals take-home minus the eight entered cost and savings categories. Figures are rounded to the nearest dollar.
Find the Category Creating the Pressure
Paycheck deductions
Compare your current pay stub with the previous one. Separate tax withholding, payroll taxes, benefits, retirement, and other deductions. Use the take-home pay change checklist if the deposit moved.
Housing
Include rent or mortgage, association fees, property taxes, insurance, maintenance, and utilities that are tied to the home. A low payment can still hide high total housing costs.
Transportation
Add payments, fuel, insurance, registration, parking, tolls, repairs, tires, and transit. The monthly payment is only one part of the cost.
Food and household spending
Separate groceries, household supplies, restaurants, delivery, and convenience purchases. Use four weeks of transactions instead of guessing from memory.
Debt payments
List the minimum, extra payment, balance, and rate for each debt. If interest is keeping the payment high, compare the debt reduction methods.
Irregular costs
Annual insurance, school costs, holidays, medical bills, repairs, travel, and gifts can make a monthly budget look better than the year really is. Divide the annual total by 12.
Seven Moves That Create Breathing Room
- Use take-home pay as the starting line. A household budget cannot spend gross salary.
- Measure the last 90 days. Three months catches costs that one unusually quiet month can hide.
- Annualize irregular bills. Add the yearly total and divide by 12.
- Choose the largest adjustable category. Saving $12 on one subscription will not solve a $900 monthly housing or transportation gap.
- Protect high-value savings. Do not treat every retirement or emergency deposit as wasted cash.
- Fix expensive debt. A lower balance can free monthly cash without requiring the same cut forever.
- Price the income gap. If reasonable spending cuts cannot close it, use the Earning Money hub to compare a raise, job change, paid skill, or side-income plan.
Build the full plan with the household budget guide. If the squeeze comes from surprises, add a starter reserve with the emergency fund guide.
$100,000 Salary Questions
Is $100,000 a good salary?
It can be strong income, but the answer depends on household size, location, benefits, debt, care costs, taxes, and housing. Compare take-home pay with required costs instead of relying on the gross number alone.
How much is a $100,000 salary per month?
Gross monthly pay is about $8,333 before payroll deductions. The deposit can be much lower after federal, state, and local withholding, Social Security, Medicare, insurance, retirement contributions, and other deductions.
Why does my paycheck feel too small for my salary?
Start with the pay stub. Compare gross pay, taxable wages, tax withholding, benefits, retirement contributions, and other deductions. Then compare the resulting take-home pay with your fixed and irregular costs.
Should I reduce retirement contributions to free cash?
First identify the size and duration of the gap. Cutting retirement savings may raise take-home pay, but it can reduce employer matching and future savings. Review plan rules, debt costs, emergency needs, and other adjustable categories before changing a contribution.
What if my budget still does not work after cutting extras?
The gap may be structural rather than discretionary. Housing, transportation, care, health costs, debt, or an income shortfall may need the main response. Price the largest category before chasing many small cuts.
Sources and Method
- U.S. Census Bureau: Income in the United States, 2024
- Social Security Administration: National Average Wage Index for 2024
- U.S. Bureau of Labor Statistics: Consumer Expenditures, 2024
- U.S. Bureau of Labor Statistics: Consumer Expenditure Survey glossary
- Federal Reserve: Economic Well-Being of U.S. Households in 2025
- KFF: 2025 Employer Health Benefits Survey
- IRS Tax Withholding Estimator
Census medians provide the worker and household comparisons. The Social Security wage index is labeled as an index, not typical pay. BLS means are used only for consumer-unit spending context, and the $104,207 BLS income figure is not treated as worker salary. The $100,000 model assigns $25,200 to illustrative payroll deductions and $74,800 to eight take-home categories. It is a zero-balance example created for explanation. It does not estimate any reader’s taxes or describe average spending.
This page provides general educational information, not financial, tax, accounting, benefits, employment, or legal advice. Costs and tax treatment differ by household, employer, plan, location, filing status, and year.